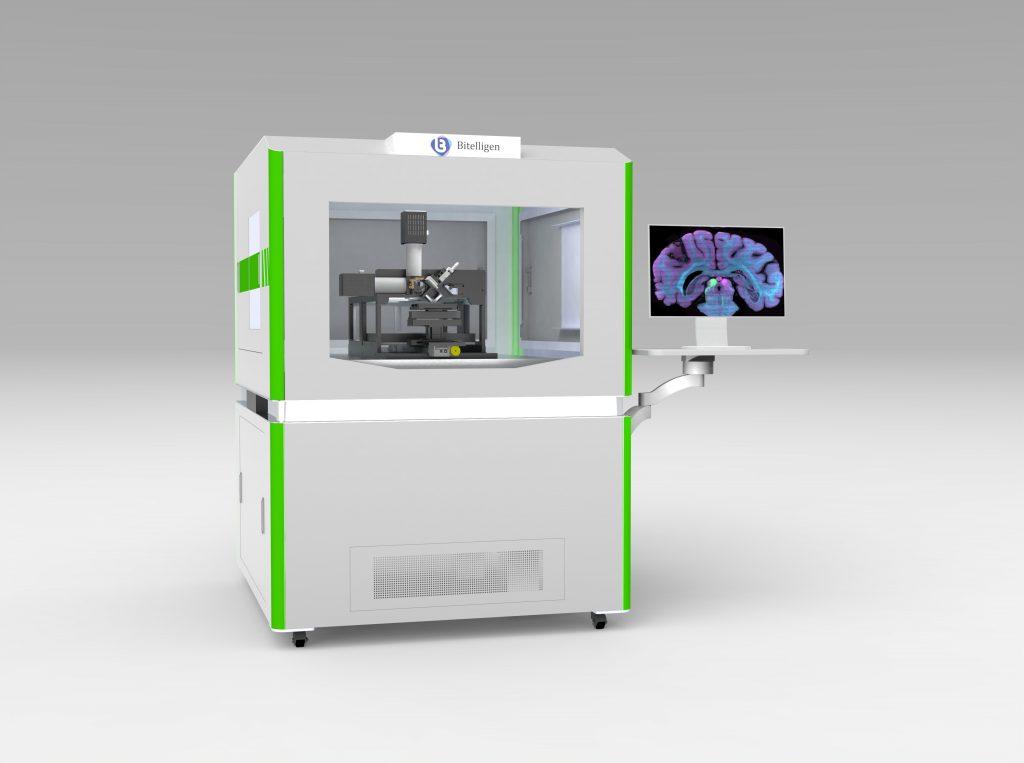
VISoR imaging
High-speed 3D imaging
from brain to body
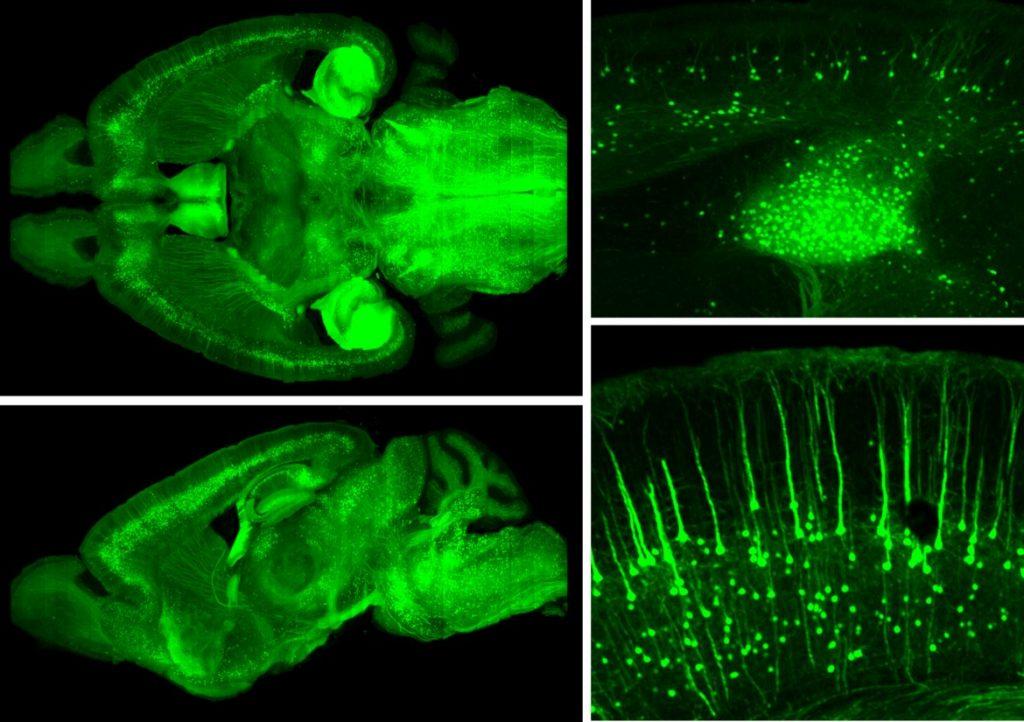
VISoR combines continuous scanning with synchronized illumination and camera readout to capture fine structures across large tissue volumes. Explore its applications in brain mapping, cellular analysis, and body-wide nerve imaging.
01 / HOW IT WORKS
Synchronized scanning for rapid 3D imaging
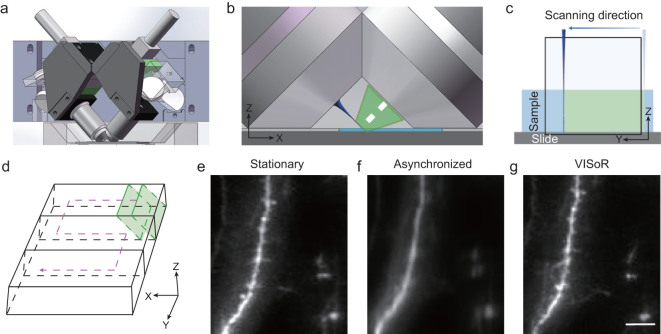
VISoR stands for Volumetric Imaging with Synchronized on-the-fly-scan and Readout.
From prepared tissue to quantitative 3D analysis.
- 01
Prepare and label the specimen
Fixation, fluorescent labeling, and clearing prepare the tissue for optical imaging. The sectioning approach depends on the specimen and the VISoR system used.
- 02
Image during continuous motion
In the original VISoR system, two perpendicular objectives are positioned at approximately 45° to the specimen plane. Scanned illumination and camera readout are synchronized with sample motion to limit motion blur. [1]
- 03
Reconstruct and analyze
Geometric correction and stitching assemble image strips and sections into a 3D volume. Depending on the study, analysis can include atlas registration, cell quantification, neuronal tracing, or fiber-orientation estimation.
| System and study | Specimen | Reported imaging time | Imaging conditions |
|---|---|---|---|
| VISoR 2019 [1] | Whole mouse brain | < 1.5 h | Voxel size: approximately 0.5 × 0.5 × 3.5 μm³ |
| VISoR2 / SMART 2021 [2] | Whole rhesus macaque brain | Within 100 h | Voxel size: 1 × 1 × 2.5 μm³ |
| blockface-VISoR 2025 [5] | Whole adult mouse | ~ 40 h | ARCHmap preparation with blockface volumetric imaging |
Times refer to image acquisition under the conditions reported in each study; tissue preparation and downstream processing are additional.
02 / RESEARCH APPLICATIONS
Neural mapping across scales
Pair VISoR imaging with labeling and analysis methods suited to your study—from tracing long-range axons to comparing cell distributions and mapping peripheral innervation.
01 / NEURAL PATHWAYS
Trace long-range axonal pathways
Follow labeled neurons and axons within the anatomical context of the whole brain. The SMART workflow extends this approach to primates, supporting the study of thalamic projections and axonal trajectories through white matter and cortical folds.
Explore SMART →02 / CELLULAR MAPPING
Compare cell distributions across regions
Combine c-Fos labeling, deep-learning segmentation, and atlas registration to quantify labeled cells across brain regions. c-Fos serves as an indirect marker of recent neuronal activation.
Explore NEATmap →03 / PERIPHERAL INNERVATION
Map nerves across the whole body
Examine spinal, sympathetic, and vagal projections alongside their target organs. ARCHmap and blockface-VISoR support the study of organ innervation and cross-segmental pathways across diverse tissue types.
Explore the whole-body study →Three studies that expanded the scale of VISoR imaging
From the mouse brain to the primate brain and adult mouse body, these studies show how advances in specimen preparation, imaging, and reconstruction extended the technology’s reach.
MOUSE WHOLE-BRAIN IMAGING
Whole-mouse-brain imaging with fine neuronal detail
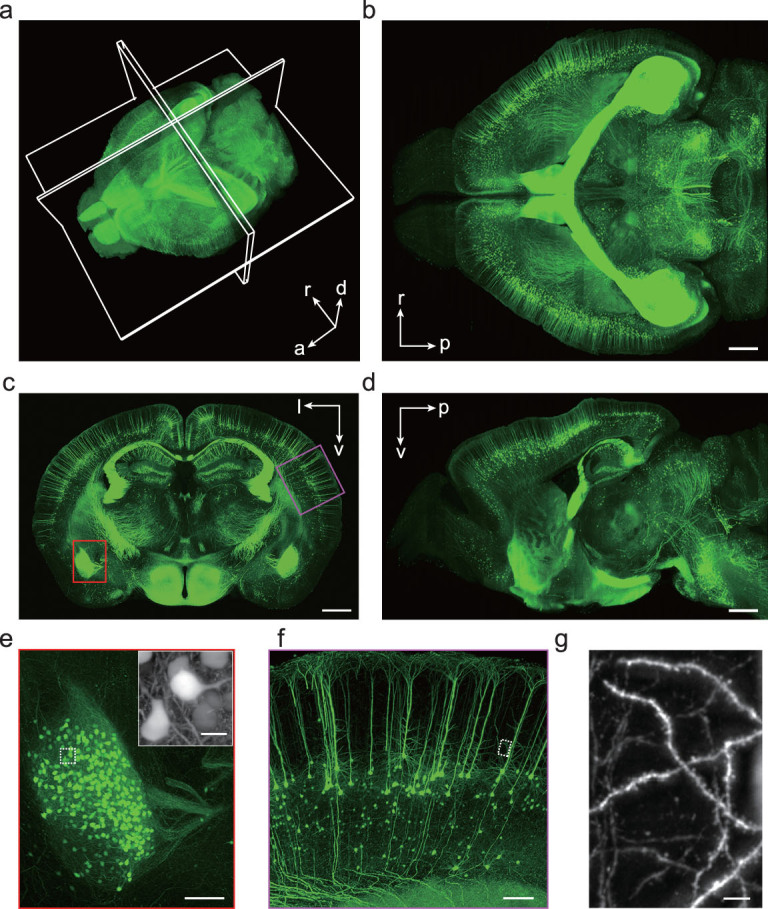
The original VISoR system combined continuous specimen motion with synchronized illumination and camera readout to reduce scanning overhead and motion blur. The system imaged a whole mouse brain in under 1.5 hours at a voxel size of approximately 0.5 × 0.5 × 3.5 μm³.
The reconstructed volume connects whole-brain anatomy with individual neurons, dendrites, axons, and dendritic spines. Figure 2 illustrates this range, from the full 3D reconstruction and orthogonal views to fine neuronal structures.
The study demonstrated compatibility with fluorescent proteins, viral tracing, and immunolabeling. Researchers can locate labeled structures within the brain, identify regions of interest, and inspect individual cells and fibers in the source images.
Read the VISoR study →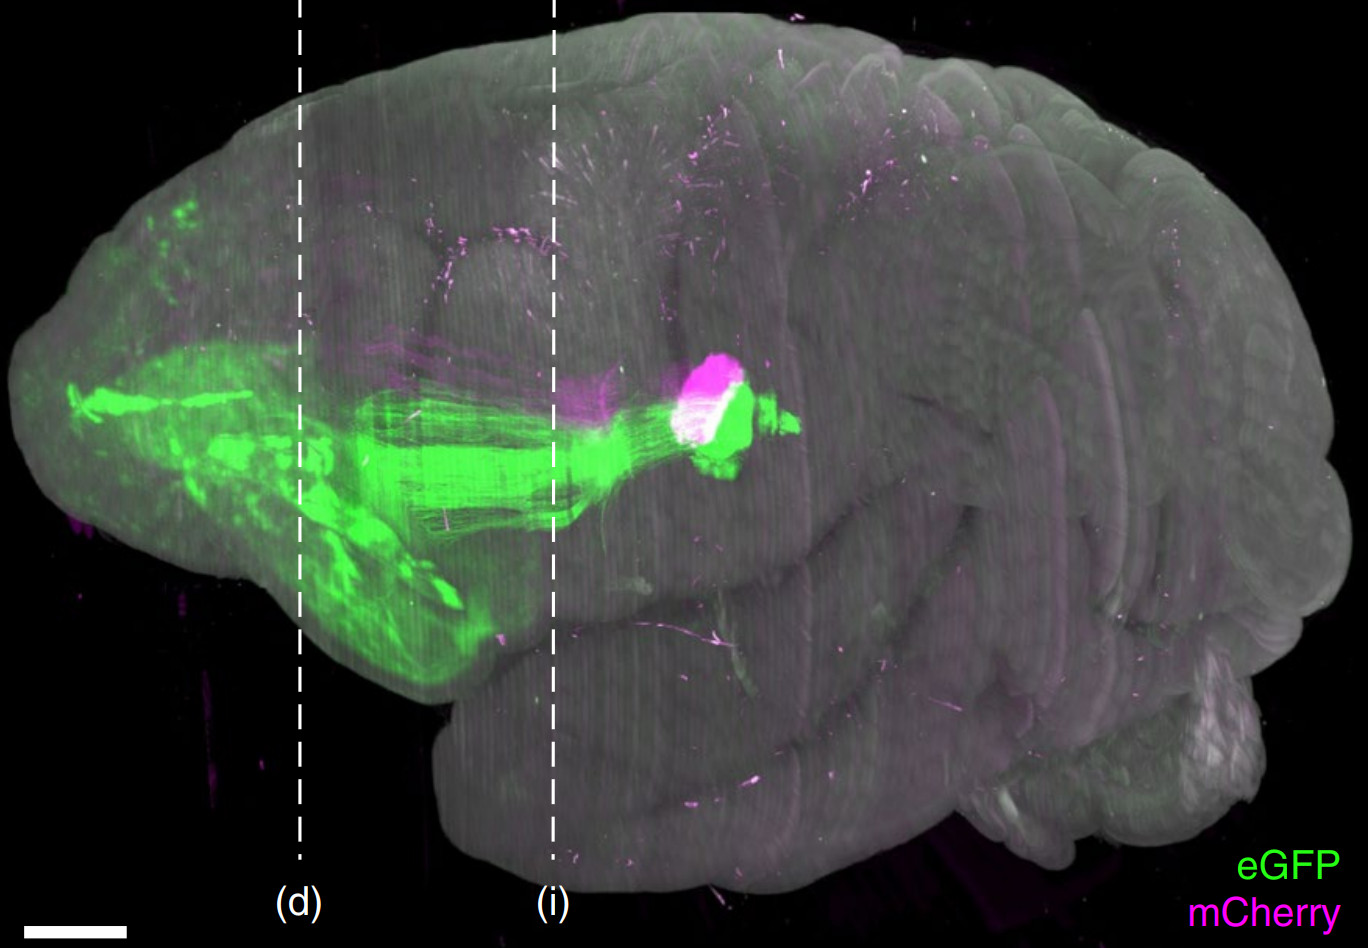
PRIMATE WHOLE-BRAIN IMAGING
Tracing long-range axons across a primate brain
SMART integrates primate-optimized sectioning and clearing, VISoR2 acquisition, 3D reconstruction, and semiautomated tracing. The study imaged an entire rhesus macaque brain within 100 hours at a voxel size of 1 × 1 × 2.5 μm³, generating approximately 250 TB of data for one channel.
Registration and stitching place individual axons within a shared whole-brain anatomical framework. The researchers followed sparsely labeled thalamocortical projections through white matter and cortical folds, across hemispheres, and into distinct branches and terminal structures.
The resulting dataset links primate brain anatomy with the detail needed for long-range axonal tracing. Software released with the study supports reconstruction, visualization, and tracing of these large image volumes.
BODY-WIDE PERIPHERAL NERVE IMAGING
Mapping peripheral nerves throughout an adult mouse
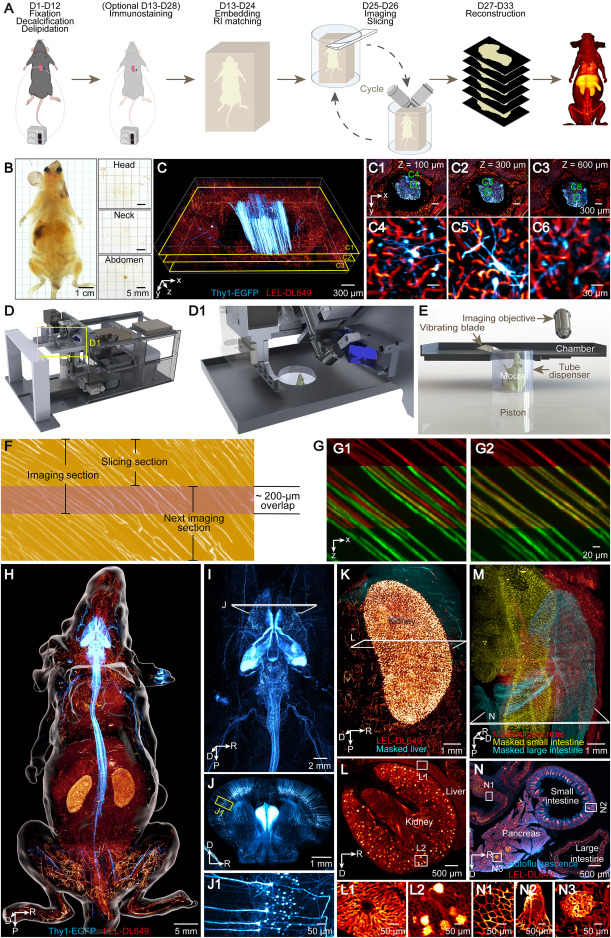
ARCHmap uses clearing and hydrogel embedding to prepare diverse tissues—including bone, muscle, fat, and internal organs—for imaging. The blockface-VISoR system alternates volumetric imaging of the exposed tissue with section removal. The study completed whole-body acquisition in approximately 40 hours, generating about 70 TB of raw data per channel.
The researchers reconstructed cross-segmental projections of individual spinal neurons, organ-specific patterns of perivascular sympathetic innervation, and complex vagal branching. These results place peripheral nerve trajectories and organ innervation within a common whole-body anatomical reference.
For further background on the technology and its development, see the USTC research report and Bineogen’s project story.
Read the whole-body study →03 / KEY PUBLICATIONS
Explore the methods and findings
VISoR: high-speed imaging with continuous scanning
Scalable volumetric imaging for ultrahigh-speed brain mapping at synaptic resolution
The foundational VISoR study introduced synchronized scanning and camera readout for rapid volumetric imaging. Whole-mouse-brain experiments demonstrated brain-wide mapping of fluorescent labels and visualization of fine structures, including dendritic spines.
SMART: whole-brain imaging at the primate scale
High-throughput mapping of a whole rhesus monkey brain at micrometer resolution
SMART extended VISoR imaging to an entire rhesus macaque brain by integrating specimen preparation, VISoR2 acquisition, reconstruction, and semiautomated tracing. The workflow enabled long-range axonal analysis in datasets spanning hundreds of terabytes.
NEATmap: quantifying brain-wide activity traces
NEATmap combines dual-channel VISoR imaging, deep-learning segmentation, and atlas registration to quantify c-Fos-positive neurons. The study mapped activity-associated cellular patterns across the mouse brain under different stress conditions.
IsoVISoR: toward isotropic 3D imaging
IsoVISoR: Towards 3D Mesoscale Brain Mapping of Large Mammals at Isotropic Sub-micron Resolution
IsoVISoR combines multiview VISoR imaging with AI-based reconstruction to improve resolution isotropy. The method recovers fine neuronal structures in three dimensions, advancing mesoscale brain mapping toward isotropic submicron resolution.
ARCHmap and blockface-VISoR: body-wide nerve mapping
High-speed mapping of whole-mouse peripheral nerves at subcellular resolution
ARCHmap tissue preparation and blockface-VISoR imaging enabled reconstruction of peripheral nerves throughout an adult mouse. The study revealed cross-segmental spinal projections, organ-specific sympathetic innervation, and complex vagal branching.
CABLE: inferring fiber pathways from cellular architecture
Whole-brain reconstruction of fiber tracts based on cytoarchitectonic organization
CABLE estimates fiber orientations from cell shape and spatial organization in 3D cytoarchitectural images. The study reconstructed brain-wide tracts from VISoR and SMART datasets and evaluated the results against virally labeled axons.
No publications match your search. Try a different keyword or filter.
04 / RESEARCH AND MEDIA COVERAGE
Research news and perspectives
Bineogen brings advanced imaging to biomedical research
A profile of Bineogen’s work in tissue preparation, 3D fluorescence imaging, data analysis, and research software.
Read in Chinese ↗CABLE infers fiber pathways from cellular architecture
How cellular morphology and spatial organization can be used to estimate fiber orientations and reconstruct brain-wide pathways.
Read in Chinese ↗Whole-mouse imaging reveals peripheral nerve organization
How ARCHmap and blockface-VISoR enable researchers to study peripheral nerves across diverse tissues and examine their relationships with target organs.
Read in Chinese ↗Mapping the rhesus macaque brain in 3D
How VISoR2 and SMART combine high-speed imaging, reconstruction, and axonal tracing to study the anatomy of an entire rhesus macaque brain.
Read in Chinese ↗BINEOGEN · SHENZHEN
Plan your imaging study
with Bineogen
At Bineogen, we help researchers plan and carry out volumetric imaging studies—from tissue preparation and VISoR acquisition to 3D reconstruction and analysis. Our workflows support atlas registration, cell quantification, and neuronal morphology analysis.
Our Lychnis software helps you explore and annotate large 3D datasets. We work with you to match the imaging and analysis approach to your specimen, labeling strategy, and research question.