From Tissue Samples to Quantitative 3D Maps
From sample preparation to quantitative analysis, we combine PuClear tissue clearing, high-throughput VISoR imaging, and proprietary analysis tools to support neuroscience, preclinical research, and studies of anatomical organization across the brain and body.
Our Services
Match the service to your study
Choose a service based on the structures you want to image, your labeling strategy, and the measurements your study requires.
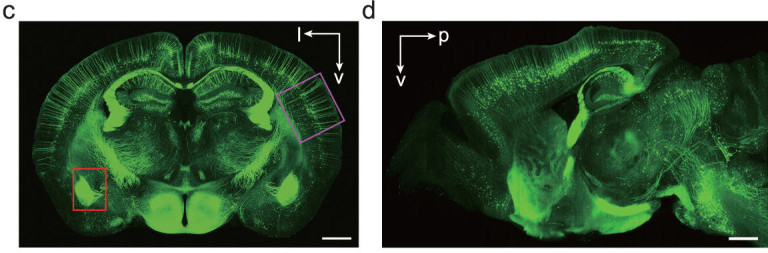
Whole-Brain 3D Imaging
Explore cells, fibers, and anatomical structures in a shared whole-brain 3D volume. Survey brain-wide labeling patterns, then examine selected regions in cellular detail.
- Preparation & imagingWe handle fixation, embedding, thick sectioning, PuClear clearing, and VISoR acquisition, with single- or dual-channel imaging tailored to your labeling strategy.
- Sampling optionsStandard whole-brain imaging uses 1 × 1 × 2.5 μm³ voxels. Finer XY sampling is available for studies focused on cellular morphology or fine axons.
- Typical outputsReceive slice-level maximum-intensity projections, raw images, and stitched 3D reconstructions for visualization and further analysis.
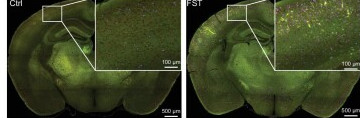
c-Fos Quantification
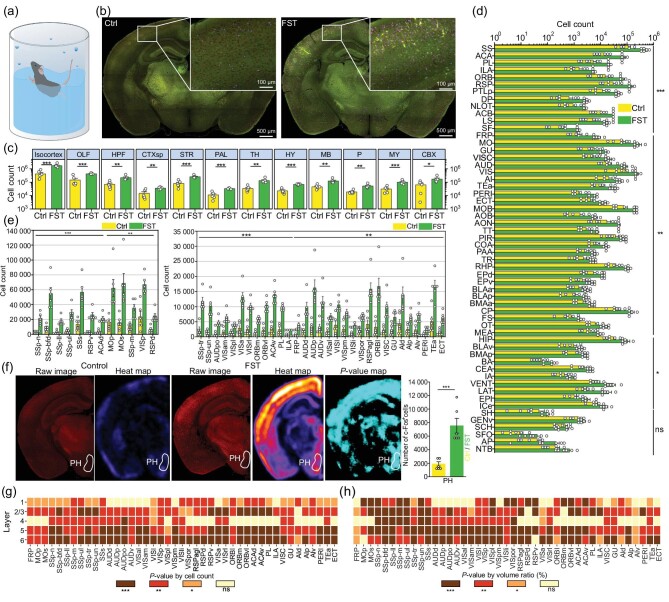
Map c-Fos-positive cells across the whole brain to characterize activity-associated patterns following behavior, stimulation, or treatment, and in disease models. Compare regional cell counts, densities, and spatial distributions across experimental groups.
- Cell detectionThe NEATmap deep learning workflow detects c-Fos-positive cells in 3D images and returns their spatial coordinates.
- Atlas registrationRegistration to the Allen CCFv3 reference atlas enables consistent regional summaries of cell counts, densities, and distributions across samples.
- Typical outputsResults can include regional cell-count tables, 3D cell-distribution maps, comparisons across experimental groups, and detailed views of regions selected for follow-up validation.
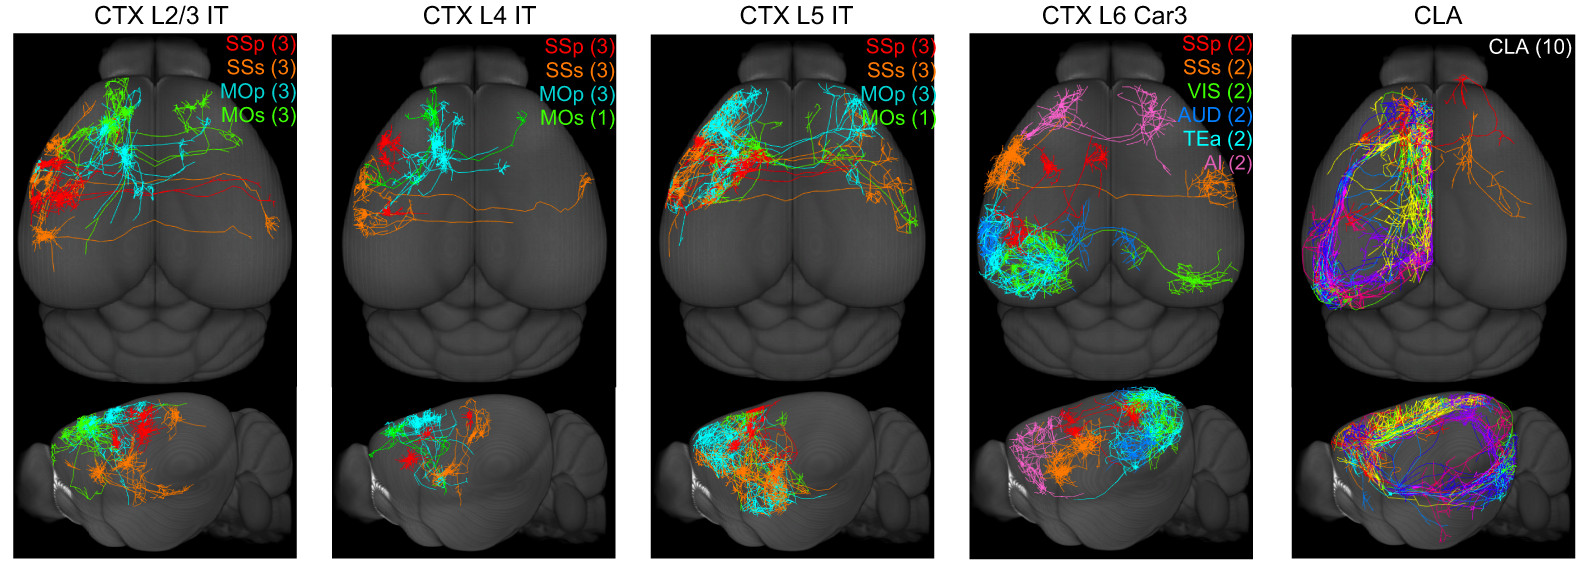
Neural Circuit Mapping
Map virally labeled projections across the whole brain. Trace long-range axons, branches, and terminal fields, and compare projection patterns across source regions, cell types, or experimental groups.
- Study designsWorkflows support anterograde and retrograde tracing, input and output mapping for selected brain regions, and single-neuron morphology studies with sparse labeling.
- Analysis optionsAnalysis ranges from whole-brain projection trajectories and regional fiber intensity to axonal branching, target distributions, and morphological comparisons.
- Typical outputsReceive whole-brain projection maps, regional fiber-intensity statistics, and spatial heat maps. Single-neuron axon reconstruction is available when labeling density permits.
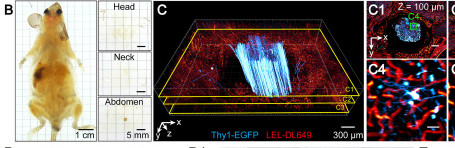
Whole-Body 3D Imaging
Image the brain, spinal cord, peripheral nerves, and organs within a shared 3D anatomical context. Follow labeled neural pathways across tissues and examine patterns of organ innervation throughout the body.
- Preparation & imagingARCHmap whole-body preparation is combined with blockface-VISoR imaging to capture anatomical continuity and subcellular detail in large specimens at high speed.
- ApplicationsStudy peripheral nerves, spinal ganglia, the spinal cord, and multiple organs together to investigate brain–body communication, organ innervation, and systemic pathology.
- Data & analysisA whole-body dataset is approximately 70 TB per channel. Optional analyses include organ localization, cross-organ pathway tracing, cell-distribution statistics, and study-specific quantification.
Research Applications
Answer questions across biological scales
Large-scale 3D imaging connects local observations with patterns across brain regions and organs. Compare cellular distributions, trace long-range projections, and examine how neural pathways relate to the tissues they innervate.
Compare activity-associated patterns across the brain
Atlas-based mapping of c-Fos-positive cells enables comparisons across experimental conditions and helps identify brain regions and spatial patterns for follow-up studies. [Neuroscience Bulletin, 2018]
Example applicationsTrace individual neurons across the brain
With suitable sparse labeling, reconstruct the soma, dendrites, axon, and terminal branches in a single 3D volume. Compare projection extent, branching patterns, and target regions across cells or experimental groups. [J. Comp. Neurol., 2019]
Example applicationsStudy innervation in its anatomical context
Continuous datasets spanning the brain, spinal cord, peripheral nerves, and organs show how labeled nerves enter tissues and are distributed within them. Compare innervation patterns and examine brain–body organization across anatomical scales. [Nat. Rev. Neurosci., 2020]
Example applicationsWhat You Receive
Data you can explore, quantify, and reuse
Combine imaging with the level of analysis your study requires. Deliverables can include raw and reconstructed images, quantitative tables, and visualizations for quality review, comparison, and further exploration.
Whole-Brain 3D Imaging
A whole-brain view of cell, fiber, and tissue distributions.
- Maximum-intensity projections
- Raw and reconstructed 3D data
- Reconstruction options: 4 μm, 1 μm, or 0.5 μm
- Single- or dual-channel image data
c-Fos Quantification
Cell-level measurements and regional summaries for comparisons across samples.
- Coordinates of c-Fos-positive cells
- Data registered to Allen CCFv3
- Cell-count tables by brain region
- 3D visualizations of cell distributions
Neural Circuit Mapping
Anatomical maps and measurements of neural inputs, outputs, and long-range projections.
- Whole-brain projection maps
- Regional fiber-intensity statistics
- Heat maps of projection distributions
- Single-neuron morphology and axon reconstructions, where labeling permits
Whole-Body 3D Imaging
Spatial datasets and analyses spanning peripheral nerves and multiple organs.
- Continuous whole-body 3D datasets
- Organ and structure localization
- Cross-organ pathway tracing and cell-distribution analysis
- Study-specific analysis reports
Workflow
From study design to data delivery
Typical project durations are approximately 10 days for standard whole-brain imaging, 10–15 days for neural circuit studies, and 60 days for whole-body imaging. Timing depends on the labeling strategy, number of samples, and scope of analysis.
Plan your imaging study
Share your research question, sample type, labeling method, and channel requirements. Our technical team will help define a preparation, imaging, and analysis workflow tailored to your study.